|
|
ShowIf you want to jump straight to tutorials on using the show component, you can use these links:A tutorial on how to make a video out of a scan matching animation. A tutorial on how to make a fly-through video. This component is for visualisation of the .frames files generated by the slam6d component. To visualise the .frames files, you must specify the folder which contains the scans (same as the one used for the slam6d component) in the command line. Still using the folder "dat" as the target folder containing the scans, the command for using the show component will be:
For a complete list of the parameter specifications for the show component, just type the command:
Using the user-interface of showAfter successfully running show, you should see three windows opened: 3D_Viewer, 3D_Viewer - Controls and 3D_Viewer - Selection.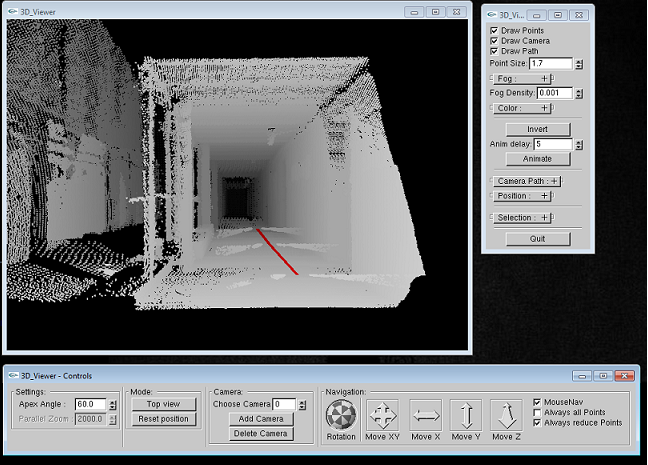 NavigationTo be able to use the mouse to navigate on the viewer, the MouseNav box on the controls window must be checked.The left button of the mouse is for rotating the viewer. The right button is for moving the viewer in the X and Y direction. The middle wheel of the mouse is for zooming in and out of the viewer. You can also use the navigation panel on the controls window to rotate and move the viewer in the X, Y and Z directions. Under the position drop-down menu on the selection window, you can save a particular position of the viewer and load it later. AppearanceYou can change the appearance of the viewer in several ways. Under mode on the controls window, you can set the view. The Top view button toggles between top view and normal view and the Reset position button sets the view to the starting position.Under settings, you can specify the apex angle of the viewer. The viewer can be slow in displaying the points if there are a large number of points to be displayed. To avoid this, you can check the Always reduce Points box on the controls window to reduce the number of points displayed by the viewer. On the other hand, you can check the Always all Points box to display all the points. On the selection window, you can hide the points on the viewer by unchecking the Draw Points box. You can also show or hide the camera by checking or unchecking the Draw Camera box. The path taken by the robot (red line on the viewer) can also be showed or hidden by the checking or unchecking the Draw Path box. You can also select point size, fog, fog density and camera path on the selection window. Large Data SetsPoint clouds acquired with modern hardware are often times very large. Show uses an octree to visualize the data efficiently. The octree increases the visualization speed by subdividing the point cloud in spatial regions to efficiently eliminate all points outside the visible frustum.During the creation of the octree a large overhead is produced. To eliminate this overhead it is recommended to produce a copy of the data in the octree file format. For visualization purposes it is usually sufficient to show only a reduced data set. Show offers an octree based reduction of the point cloud.
NR. For each occupied voxel the center
point is used. With the additional parameter
Related Publications
|
Informatics VII - Robotics and Telematics, Prof. Dr Andreas Nüchter, andreas (at) nuechti.de, Tel. +49-177-7951270